Overview
Company Analytics gives you embedded, ready-made people dashboards that replace the old static analytics — organised across four easy-to-navigate sections:
- Overview — Active Headcount, Growth Rate, New Hires, Leavers
- Workforce Composition — Headcount by Department, Tenure Distribution, Average Tenure
- Attrition & Retention — Turnover Rate, Attrition Rate, Attrition by Department, Voluntary vs. Involuntary
- Diversity & Inclusion — Gender Ratio, Age Distribution, Nationality Breakdown
Important Notice:

This is an early version of Company Analytics, so things may still be evolving.

Want access? Just email us at support@omnihr.co or reach out to your account manager.
TABLE OF CONTENTS
- What can Company Analytics do right now?
- How to turn it on for your team
- How to use Company Analytics (People)
- Understanding the Global Filters
- Important Notes
What can Company Analytics do right now?
- What data it can look at — with this early release, Company Analytics will focus on people data - looking at basic employee information & employee job record only.
| Category | Fields |
|---|---|
| Identity | Name, Preferred Name, Legal name, Employee ID, System ID, Email |
| Demographics | Age, Gender, Date of Birth, Nationality, Marital Status |
| Job | Department, Position, Team, Employment Type, Company, Location |
| Status | Employment Status (Active / Terminated / Future Hire), Start Date, Termination Date |
| Probation | Probation Status, Probation End Date, Notice Period, Confirmation Date |
- Who can see what — The data presented in the dashboards follow the same access rules already set up in your system. So if someone isn't normally allowed to see certain employee details, the dashboard reports won't show that information either.
How to turn it on for your team
Please ensure you have gained access to the module before proceeding with the steps below. Write in to support@omnihr.co for assistance.

If you are enabling Company Analytics, this will replace the old analytics module.
- Go to Settings > Access Control.
- Select the relevant Role i.e. Admin
- Go to System Permissions > Analytics.
- Turn on View Company Analytics.
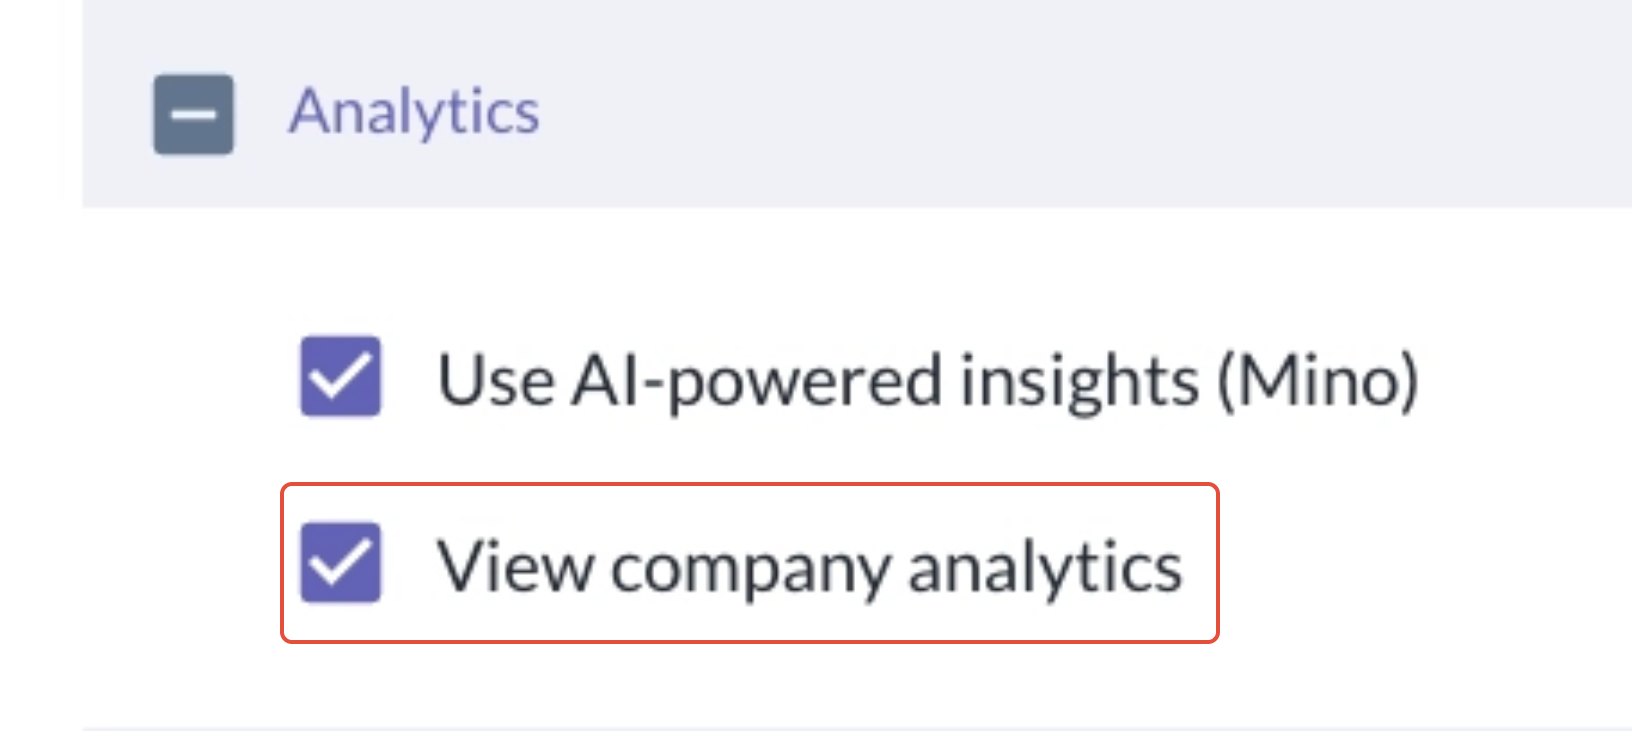
That's it — anyone with that role will now be able access Company Analytics.
How to use Company Analytics (People)
- Go to Analytics > Company Analytics.
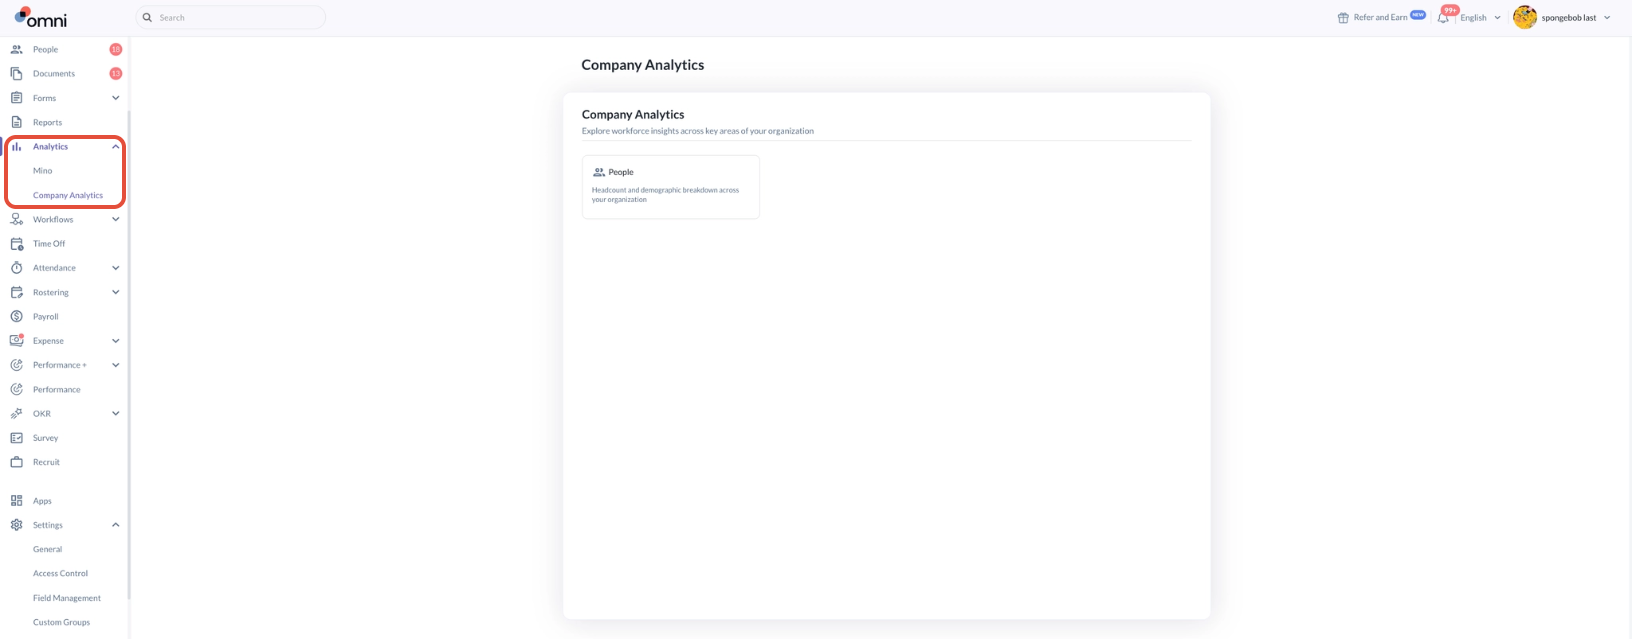
- Click into People and you'll be brought to a dashboard with the embedded reports:
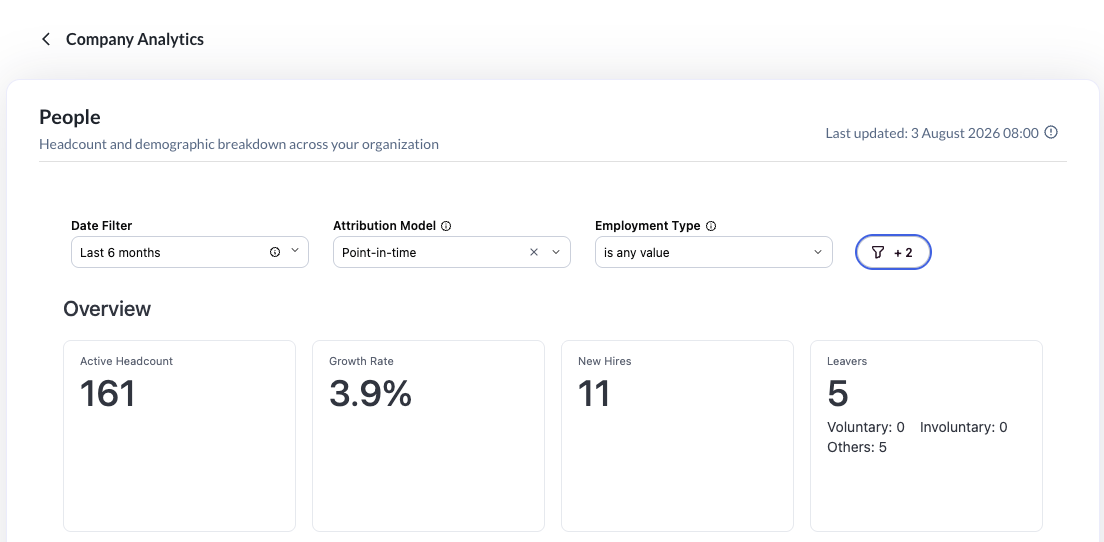
- Overview
- Workforce Composition
- Tenure
- Attrition & Turnover Trend
- New Hire Retention
- Diversity & Inclusion
- We have 5 global filters that lets HR slice and dice the data according to their needs:
- Date filter
- Attribution model
- Employment type
- Department
- Job location

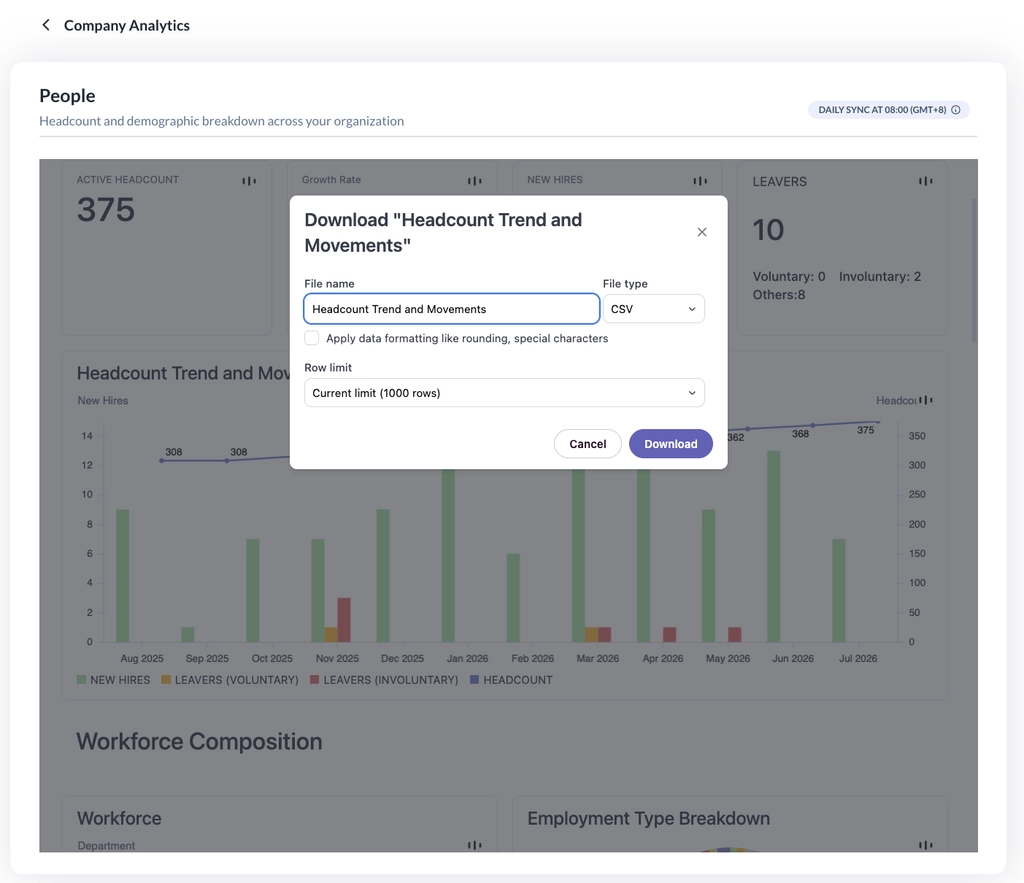
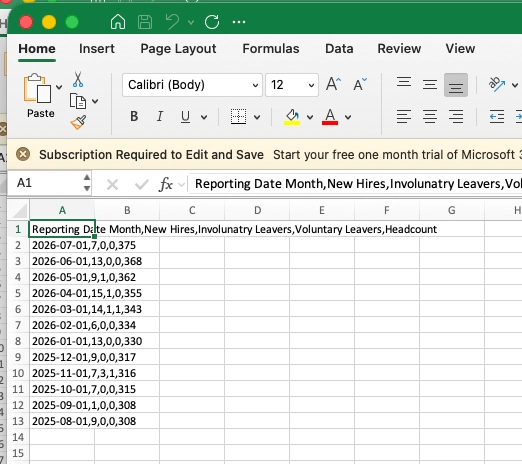
- You can download the underlying data behind any chart for your own use by clicking on the three ellipses next to any chart.
Understanding the Global Filters
Date Filter
- Every chart on the page shares one date filter. By default it shows the last 6 months data and applied to all charts except the new hire retention.
- Special case: When you filter by a partial date range, new hires and leavers are counted strictly within your selected dates, while the trend chart continues to group by calendar month so month-on-month comparisons stay consistent.
Example: filtering 10 Jan – 10 Mar now shows:- Summary: Active headcount as of 10 Mar (end of date range), with total new hires and leavers between 10 Jan and 10 Mar
- Trend chart: For three months -
- January counts hires and leavers from 10–31 Jan (headcount as of 31 Jan),
- February covers the full month (headcount as of 28 Feb), and
- March counts 1–10 Mar (headcount as of 10 Mar)
- Tenure and diversity breakdowns: based on employees active as of 10 Mar
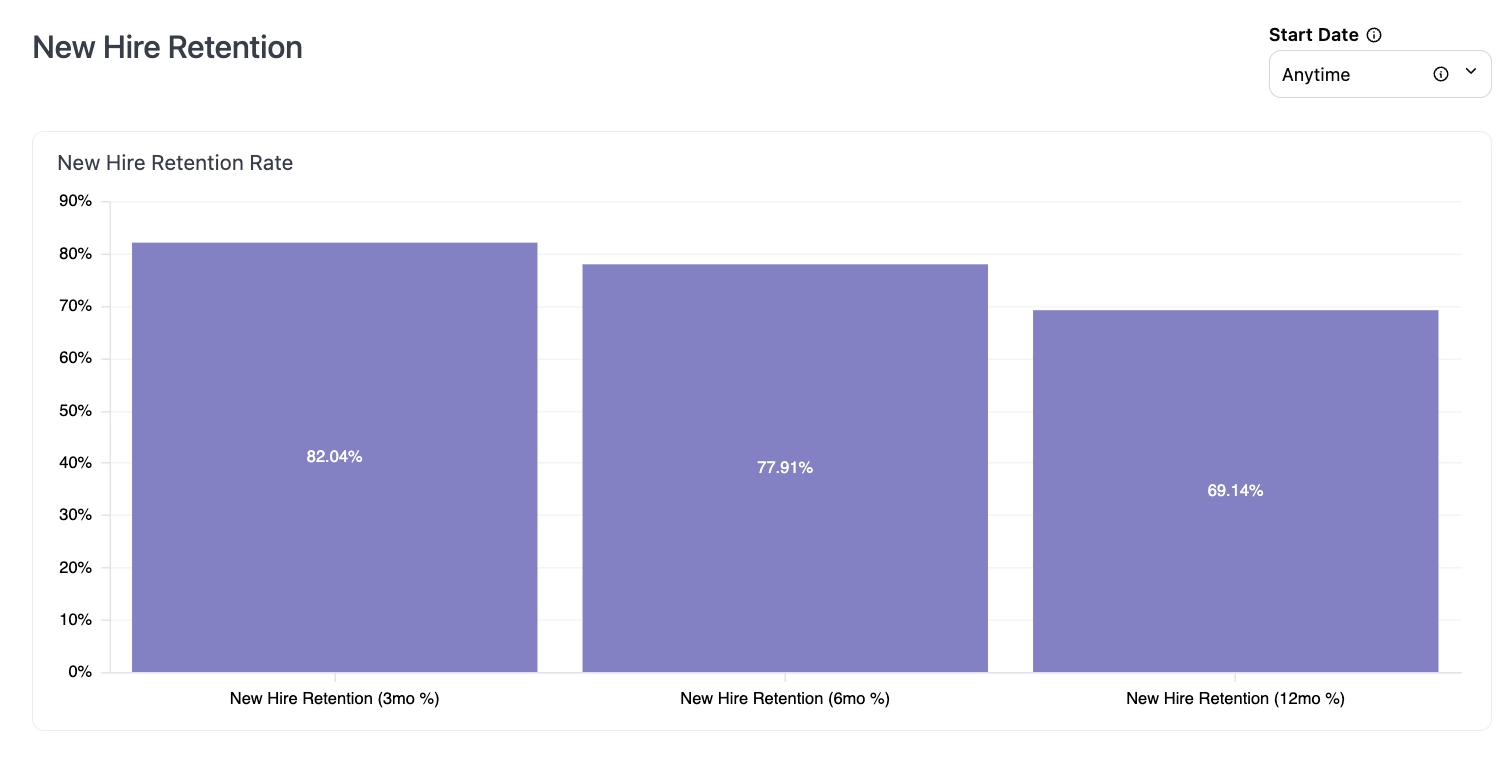
- New hire retention notes: New hire retention has its own filter to define the start date of new hire that HR want to observe. By default, it includes all employees from any start date.
- Special case: When you filter by a partial date range, new hires and leavers are counted strictly within your selected dates, while the trend chart continues to group by calendar month so month-on-month comparisons stay consistent.
Attribution Filter
- This decides which department (or other attribute) a metric uses when an employee has moved around during the period. Default is point-in-time; users can switch via the attribution toggle.
- Point-in-time: uses the department the employee was in at each point in time. Most accurate for history or audit.
- End-of-range backfill: uses everyone's department as of the last day of the range, applied across the whole period. Best for manager or post-reorganisation views.
Employment type, department, job location
- By default it shows all values from these filters. HR can also use these filters in combination. User attribution like location, employment type, department is derived from job event history.
Active, probation, and termination
Active (with start date), probation (with probation date), and termination (with LDOW) is taken from the employment status section.
Important Notes
| Topic | What you need to know |
|---|---|
| Data refresh | Data updates about once a day, not instantly. So if you change someone's access or there has been new updates to employee data, it may take up to a day to fully take effect.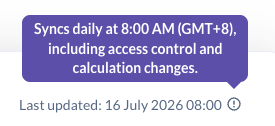 |
| Data coverage | Some information isn't available yet, including manager history, personal identity details (like visa info), contact details, expense data, and compensation. These are planned for a future update. |
Still Need Help?:
Reach out to our support team should you need further assistance.
Was this article helpful?
That’s Great!
Thank you for your feedback
Sorry! We couldn't be helpful
Thank you for your feedback
Feedback sent
We appreciate your effort and will try to fix the article